Data-Driven Decision Making (DDDM): How You Are a Data Analyst and Don’t Even Know It

Every day we are faced with a multitude of decisions that are subconsciously being determined by data. Where is the cheapest place near me to buy gas? How busy is Trader Joe’s right now? What movie should I watch next? While emotions and instinct still play an important role in how we make our decisions, data can allow us to expedite the decision-making process by giving insights that help avoid potential risks and identify new opportunities.
Embracing Data in the Workplace
We have come to embrace the benefits of data in our daily lives and can learn the same in the workplace without having a background in data analytics. With a wide variety of tools available, the ability for us to implement a data-driven culture is becoming increasingly more accessible as well as important. As an organization or team wanting to leverage the benefits of the information you should or could be collecting, there are a few fundamental elements that can help pave the way.
Make Data Widely Available
Making data more accessible allows teams to better engage, ask questions, and collaborate. Those in specialized areas may even have an advantage over trained data experts due to their expertise in that field. Often this can lead to better questions around the data.
For most people, looking at a sizeable spreadsheet of raw data can be overwhelming. By implementing analytic tools, data can be transformed into visualizations that are more palatable for you and your team to understand.
Standardized Data Collection Processes
The data you collect should be determined by what objectives your team is attempting to achieve. While you may think “the more the better” in terms of values, it’s best to only collect the most meaningful information to allow for ease of entry, accuracy, and data cleansing down the line.
With all of that in mind, you first must decide what tool you will use to collect your data. There are lots of options out there but selecting the tool that is right for you is the most important step. Here are a few things to keep in mind during your search.
- Flexibility: Data values can range from text, dates, currencies, and much more so the tool you select should allow for proper data-value formatting.
- Accessibility: When collecting data, you want to ensure your audience will have easy access to the tool you’ve selected. Always consider the limitations and restrictions that may inhibit some user’s ability to access the platform of your choice.
- Reliability: Your collection tool should allow you to apply controls and validations around your data to avoid open-ended entries. By doing so you can improve the precision of what you are collecting and reduce efforts during the data cleansing process.
Data Management
Next, you will need to standardize how you store and organize your data. Storage can vary based on the size of your organization or project needs, so be sure to find a plan that is manageable to your objectives and can showcase data in a manner that makes the most sense to you and your team.
Here are a few helpful tips to consider when organizing your data:
- Conventional Labeling: Give consistent and meaningful naming conventions to the information you collect.
- Relatable Data: Values in your dataset should have meaningful relationships.
- Data Formatting: Format values appropriately, improperly formatted data can affect how it displays later when you are creating visualizations.
Cleansing Your Data
A clean dataset improves reliability and generates better results. Here are a few best practices you can use when reviewing and cleansing your data:
- Address Missing Data: Leaving data points blank will damage the integrity and accuracy of your data. It is good practice to input a value where there is missing data or consider removing observations with missing values.
- Address Outliers in Your Data: Investigate your outliers and confirm their legitimacy. Removal of any values within your dataset should be avoided unless they are deemed invalid or inaccurate—do not remove values just because they disagree with the narrative of your hypothesis.
- Correction to Errors: These include typos, mislabeling, abbreviations, inconsistent capitalization, inaccurate formatting, and incomplete information. As most data will be entered manually, there is always a chance for human error. Reviewing data through filters can help you identify and correct these without having to sift through the entire dataset.
- Iterating and Improving Data Collection: It is important to track and understand patterns of the data you are repeatedly cleansing within your dataset. By doing so you can begin to identify areas of improvement for your data collection process.
Visualize Your Data
Data visualization helps tell a story to your audience by pulling back the curtain on data you’ve collected to reveal something that may have been hidden within your datasets. Visualizations in the form of reports and dashboards help take a large amount of information and turn it into something that is quickly comprehended, allowing you and your team to act promptly on the data you are observing. Over time with a solid collection, management structure, and cleansing process you can begin to analyze trends that will improve your decisions and help mitigate risk.
Keep these points in mind when selecting a tool to visualize your data:
- Shareability: Know your audience. Some tools require licenses for you to share your reports or dashboards with internal or external users. Select something your peers will be able to readily access.
- Usability: Determine the amount of effort it takes to produce visualizations and export infographics of your results.
- Compatibility: Be sure the tool you decide on integrates well with your existing IT environment.
- Scalability: The tool you choose needs to handle the amount of data that you will collect, not just now, but as your team and your data grow over time.
Tools to Make the Most of Your Data
Collecting, organizing, and visualizing your data requires a set of tools that work for you and your organization. Here are a few recommendations on tools that work for us.
- Collection
- Organization and Cleansing
- Visualization
- Excel
- PowerBI
- Tableau
- Microsoft Teams
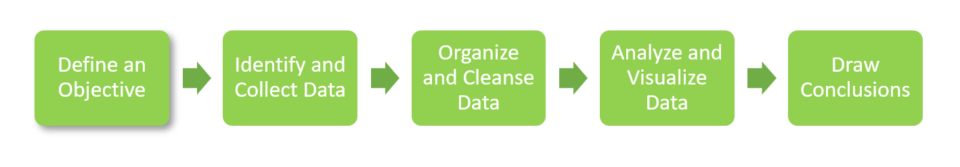
The Flow for Data-Driven Decision Making
Summary
By embracing a data-driven culture and leveraging a toolkit that fits your needs, you can start collecting the right data to help you and your team in making better-informed decisions that will help increase productivity, mitigate risk, and promote collaboration.
Getting serious about collecting and analyzing information is only the first step to leveraging data to empower your organization. If you would like to learn more, reach out to chat about a data solution that works for you!

Travis Brown
Travis Brown is an Engagement Project Manager with BCForward. He has over 6 years of experience in global management, consulting, and development. He delivers white glove treatment to clients from startups to Fortune 500 organizations using innovation and technology across IT functionalities.
Have a QA question?
Our team would love to help!